RIVER HEALTH INDICATOR
POLLUTION
Nitrogen, phosphorus, and sediment are top pollutants found in the Potomac River and its tributaries. While each occurs naturally, excess amounts of nutrients (nitrogen and phosphorus) and sediment can harm aquatic life, degrade wildlife habitat, contribute to harmful algal blooms, and make local streams, rivers, and drinking water sources unsafe.
Nutrient and sediment pollution continues to decrease in the Potomac over the long term, but short-term trends show mixed results. Improvements in agricultural land practices over the last two decades have resulted in decreasing concentrations of pollution from rural areas; however, excess nutrients and sediment from polluted urban runoff is increasing over time and threatens to undo decades of progress.
In addition, emerging threats, such as harmful bacteria and road salt, could pose challenges as they aren’t regulated or enforced under the Chesapeake Bay cleanup plan, a federal-state partnership to lower pollution and restore the region’s water quality.

Nitrogen
Previous Grade: A

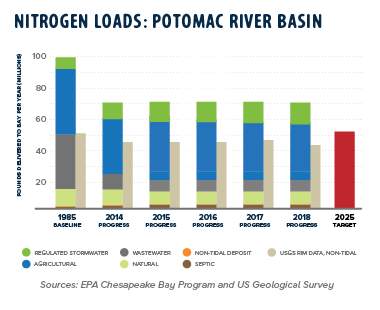
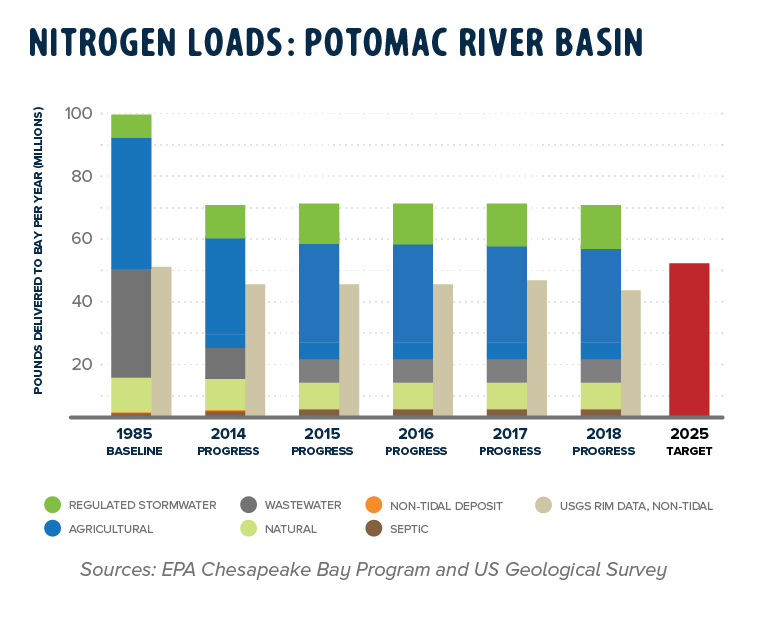
Nitrogen levels in the Potomac are improving in the long term (since 1985) and in the short term (since 2007). The EPA set a revised pollution reduction goal for nitrogen loads in the Potomac at 48.01 million pounds per year by 2025. USGS data from non-tidal waters confirmed an estimated load of 44.6 million pounds in 2018. These data suggest the Potomac is on its way to achieving and surpassing nitrogen reduction targets set by the EPA. Unfortunately, not all sources of nitrogen are decreasing; nitrogen delivered through urban and suburban stormwater continues to increase due to increased development in the region. Efforts to reduce and filter polluted runoff are beginning to show progress, but more work is required to meet stormwater reduction targets.
Why is this in my water? Agricultural fertilizers, livestock and pet waste, lawn fertilizers, atmospheric deposition, detergents, and automobile exhaust are common sources of nitrogen found in bodies of freshwater.

Phosphorus
Previous Grade: A

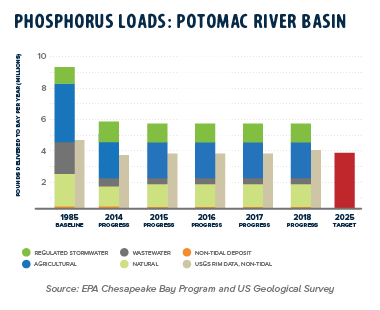
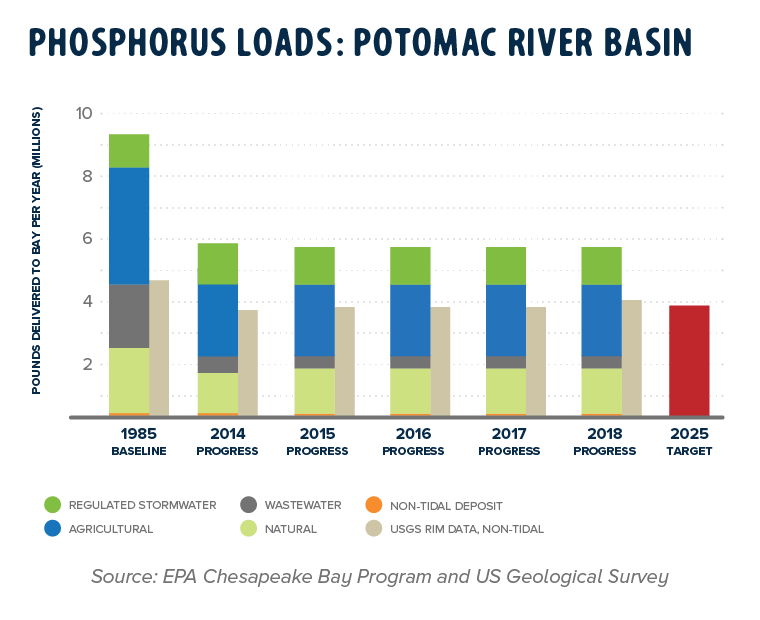
Phosphorus levels are improving in the long term (since 1985) but are degrading in the short term (since 2007); phosphorus levels have been on the rise in the last three years. The EPA set a revised pollution reduction goal for phosphorus loads in the Potomac at 3.898 million pounds per year by 2025. USGS non-tidal flow normalized testing observed 4.02 million pounds of phosphorus in 2018. Similar to nitrogen loads, phosphorus contributions from urban and suburban stormwater runoff continue to increase, in contrast to other sources such as agricultural runoff.
Why is this in my water? Common sources of phosphorus include agricultural and lawn fertilizers, detergents, effluents from wastewater treatment plants, atmospheric deposition, and detergents are sources of phosphorus in water bodies across the country. Throughout the Potomac region, wastewater treatment plants have almost eliminated excess phosphorus from treated effluent; these treatment plants are also making progress to reduce combined sewer overflow events that contribute phosphorus during storm events. In addition, bans on phosphates in residential lawn fertilizers is likely helping. Unfortunately, similar to nitrogen loads, phosphorus loads in urban and suburban stormwater runoff continue to increase.

Sediment
Previous Grade: A-

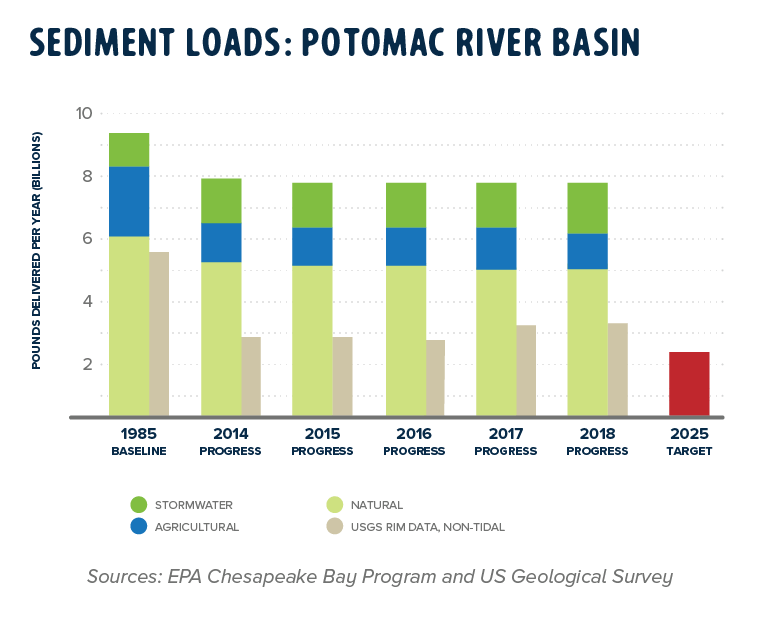
Sediment levels are improving in the long-term (since 1985) but have been relatively stable in the short term (since 2007); in the last two years, sediment levels have been on the rise likely due to higher than average annual rain totals. The EPA set a pollution reduction goal for sediment loads in the Potomac at 2.26 billion pounds* per year by 2025. USGS data from non-tidal waters confirmed an estimated sediment load of 3.17 billion pounds in 2018. Increased urban and suburban development and the conversion of natural lands to agriculture or forestry production, changes the rate at which water flows across the landscape and increases sediment pollution from stormwater runoff.
Why is this in my water? Streambank erosion occurs naturally as streams and rivers wind their way across the landscape; however, excessive erosion threatens water quality, habitat, and public health. Increased urban and suburban development and the conversion of natural landscapes to agriculture or forestry production, changes the rate at which water is absorbed by and flows across the landscape. Removal of streamside vegetation also exposes streambanks to increased erosion. And, like both nitrogen and phosphorus, sediment in urban and suburban stormwater runoff continues to increase.
Refer to the Methodology section below for an update to the sediment target.
Resources and Methodology
The Potomac River is part of the US Environmental Protection Agency’s (EPA) largest regional cleanup plan in the country, a restoration plan that targets the entire Chesapeake Bay watershed. The cleanup plan includes goals for the reduction of nitrogen, phosphorus, and sediment in the Potomac and other Bay rivers by setting a pollution limit, called a total maximum daily load (TMDL), by state and source. Sources of pollution include agriculture, regulated stormwater, urban polluted runoff, wastewater treatment discharges, and atmospheric deposition.
The EPA tracks the flow of pollutants in the Chesapeake Bay watershed by using modeled estimates of pounds per year saved by best management practices (BMPs). Six states and the District of Columbia must meet their pollution reduction goals by 2025. In 2019, each jurisdiction released implementation plans intended to show specific plans to meet pollution reduction requirements. For this report, we look at modeled pollution data from the Phase 6 Chesapeake Assessment Scenario Tool (CAST).
In addition to the EPA’s modeled data, this report includes United States Geological Survey (USGS) monitored pollution loads observed at a River Input Monitoring (RIM) station at Chain Bridge on the Potomac River. Data from the USGS RIM station determine how much pollution is observed in the river entering Washington, D.C., while the EPA model assesses trends in all pollution sources across the entire watershed. A comparison of the non-tidal water quality data (USGS) to the watershed-wide modeled data (EPA) is helpful in assessing pollution trends and produces a more complete picture of the river’s health.
Flow-normalized data from the USGS RIM station is used for this analysis to enable a more direct comparison across time series. Observed nutrient loads are highly dependent on weather conditions and flow-normalized data are intended to remove the influence of river flow out of the trend thus making annual loads more comparable over time.
We have applied the established 2025 Planning Target load goals for nitrogen, phosphorus, and sediment in 2018 to measure pollution reduction progress through the same year. Since that time, the Principal Staff Committee of the Chesapeake Bay Program has released a revised 2025 Planning Target load for sediment in the Potomac River basin (4.791 billion pounds). Ahead of the next report, we will assess the new sediment target and the methodology by which the Committee arrive at this new goal.

 Pollution
 Fish
Fish Land
Land People
 Back to the River


 Printed
 Press
Press